* Enable jitdump profiling support by default

This the result of some of the investigation I was doing for #1017. I've
done a number of refactorings here which culminated in a number of
changes that all amount to what I think should result in jitdump support being
enabled by default:

* Pass in a list of finished functions instead of just a range to
  ensure that we're emitting jit dump data for a specific module rather
  than a whole `CodeMemory` which may have other modules.
* Define `ProfilingStrategy` in the `wasmtime` crate to have everything
  locally-defined
* Add support to the C API to enable profiling
* Documentation added for profiling with jitdump to the book
* Split out supported/unsupported files in `jitdump.rs` to avoid having
  lots of `#[cfg]`.
* Make dependencies optional that are only used for `jitdump`.
* Move initialization up-front to `JitDumpAgent::new()` instead of
  deferring it to the first module.
* Pass around `Arc<dyn ProfilingAgent>` instead of
  `Option<Arc<Mutex<Box<dyn ProfilingAgent>>>>`

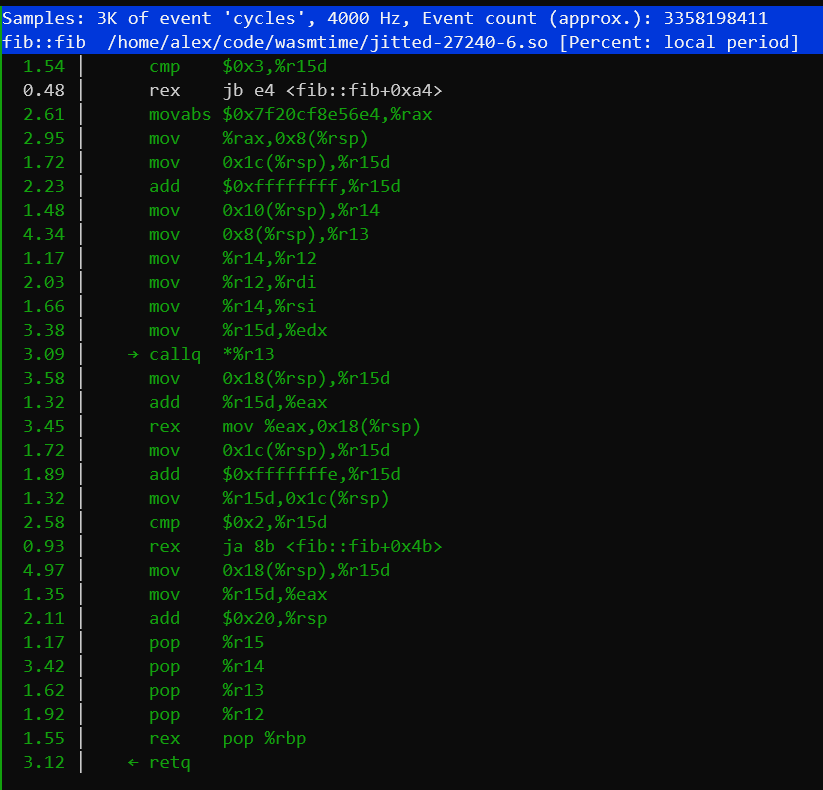
The `jitdump` Cargo feature is now enabled by default which means that
our published binaries, C API artifacts, and crates will support
profiling at runtime by default. The support I don't think is fully
fleshed out and working but I think it's probably in a good enough spot
we can get users playing around with it!
58 KiB
Executable File
823x790px
58 KiB
Executable File
823x790px
